For the next 6-8 months we will use combined 11g/10g middleware infrastructure, because of it we have to use standalone Oracle HTTP Server 10g (10.1.3.1.0). Only this Oracle HTTP server, based on top of Apache HTTP 2.x, able to work with Oracle Single Sign-On 10g (mod_osso) and Weblogic servers (mod_wls) together. Unfortunately Oracle develops their products so fast, that forgets to support their own support products. Oracle EM 12c nor even Oracle EM 11g couldn’t discover and collect metrics for this product. Of course there is a recommended way to register Oracle HTTP Server manually (i.e. #1274815.1 on Metalink). After that OEM able to see state of the product and that’s all, you even could not stop or start it from EM Console.
The good point is that there is another almost straight way to collect server metrics with OEM CC agents and repository. For Old versions of OEM you were able to define so-called User-Defined Metrics. In the newest version of OEM Metric Extensions were introduced. It’s a more powerful way to extend functionality monitoring abilities for OEM 12c. Let’s go thru the practical task and take under monitoring the old Oracle HTTP server 10g. To do this we should:
- Register Oracle HTTP Server in OEM 12c
- Enable internal server statistic collection publication
- Provide this statistic to the agent
- Collect and publish metrics on the Management Server
Enable publication of server statistics
Oracle or to be correct Apache HTTP Server allows you receive internal server information and load statistics. This functionality is provided by mod_info module and disabled in the default configuration.

Al that we should do is:
1. Create copy of your current configuration
$ cp $ORACLE_HOME/ohs/conf/httpd.conf $ORACLE_HOME/ohs/conf/httpd.conf.stat
2. Open httpd.conf file for edit
$ gedit $ORACLE_HOME/ohs/conf/httpd.conf
3. Make sure that mod_info is loaded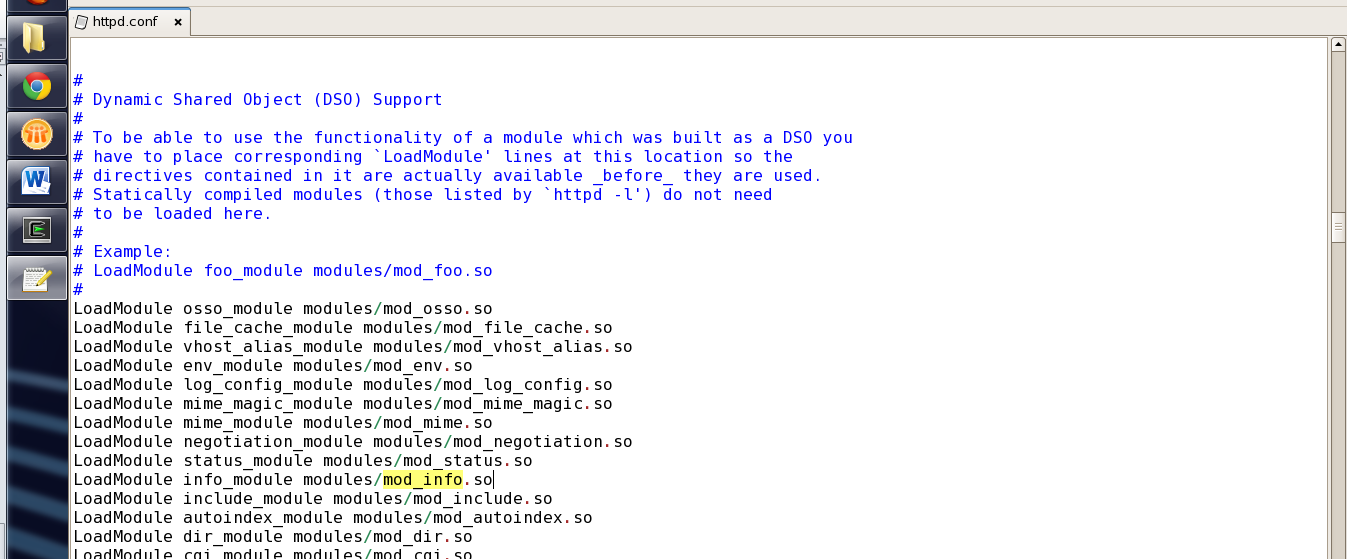
4. Enable access to server statistics from your local domain or only from localhost.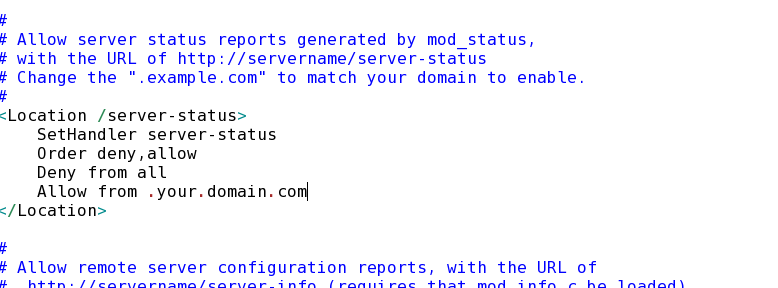
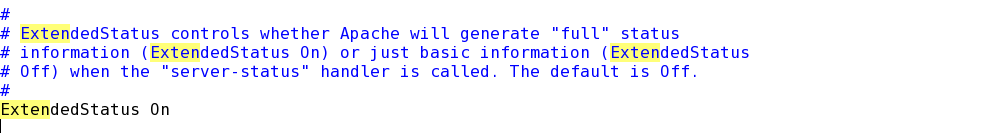
5. Also we need to enable extended statistic generation. Find parameter ExtendedStatus and set it’s value to On
6. Additionally, you may enable /server-info also, but remember it’s not secure.
7. Save the changes
8. Restart Oracle HTTP Server to apply the changes.
$ $ORACLE_HOME/opmn/bin/opmnctl restartproc
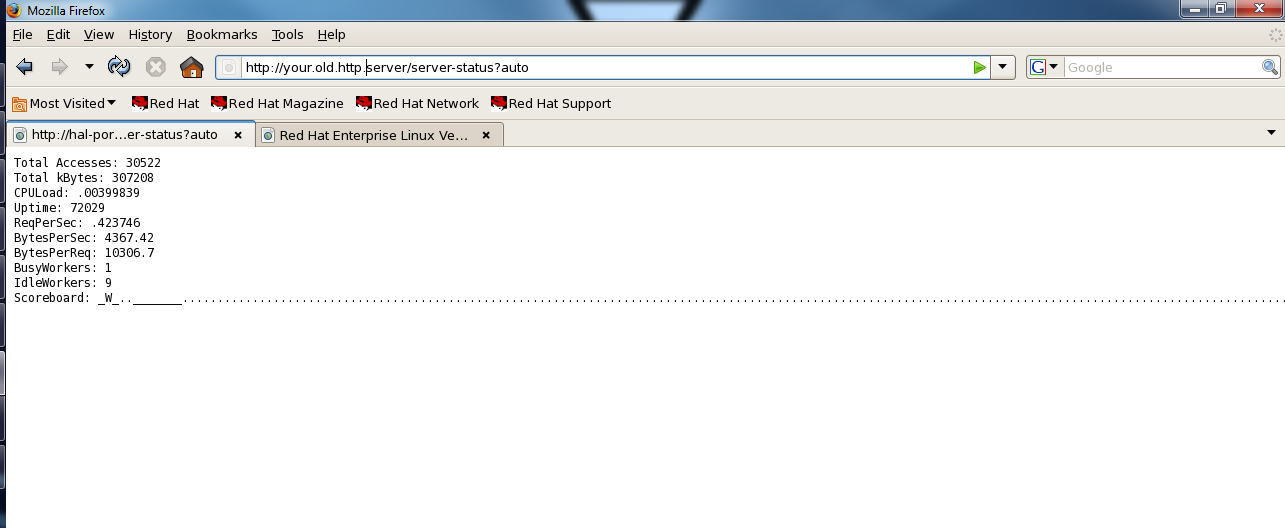
9. Check that you able to see server statistics
10. Server gives us extended statistic information in as a simple HTML text and with auto parameter it provides plain text information
We are ready to automate collection of server statistic.
Provide statistic to the agent
Even in automated mode server statistic that we received on previous steps is not suitable to feed up the OEM Agent. We should prepare and format this data (i.e. remove field names and Scoreboard string). I have no idea how it could be done on Windows platforms without coding, hopefully I use Linux and all that we need was created long time ago. So we are going to:
- Transfer HTTP data to the standard output
- Clean unnecessary information
- Format output string for OEM Agent
To do this, I’ve create a small shell script that accept two parameters (host name and port), get the data, and transform it
#!/bin/sh
# Input parameters
# HTTP host name
# Http listen port
if [ -z $1 ]; then
hst=`hostname -f`
else
hst=$1
fi
if [ -z $2 ]; then
prt=7777
else
prt=$2
fi
echo `wget -qO- http://$hst:$prt/server-status?auto | awk -F ": " '$1!="Scoreboard" { print $2}' |awk '{printf "%s",$0"|"}'`
I get the statistic data using wget and send it to the standard output.
Pass all information to the awk to remove field names and the Scoreboard string
Pass result to awk again to create one string with ‘|’ as a divider.
Save this script and if set appropriate default values you should see something like this
$ bin/htpstat.sh
31046|309007|.00409926|72940|.425638|4338.13|10192.1|1|9|
We got the well formatted data and able to configure new metric extension.
Create OEM 12c Metric Extensions
Metric Extensions is a new OEM 12c feature with a much more functionality than it was in previous versions with User Defined Exceptions. We will use only small part of it, just enough to our needs. So, create new Metric Extension to collect server status from Oracle HTTP Server 10g. To do it, we should complete follow steps:
1. Login to Oracle Enterprise Manager 12c Console with Admin privileges
2. Open Metric Extensions page from Main menu: Enterprise -> Monitoring -> Metric Extensions
3. Push create button on the panel just above extensions list 
4. The master will guide you thru the all steps of extension creation process.
Fill out the General Extension information. Select Target Type – Oracle HTTP Server, Adapter – OS Command – Multiple Columns and all other information.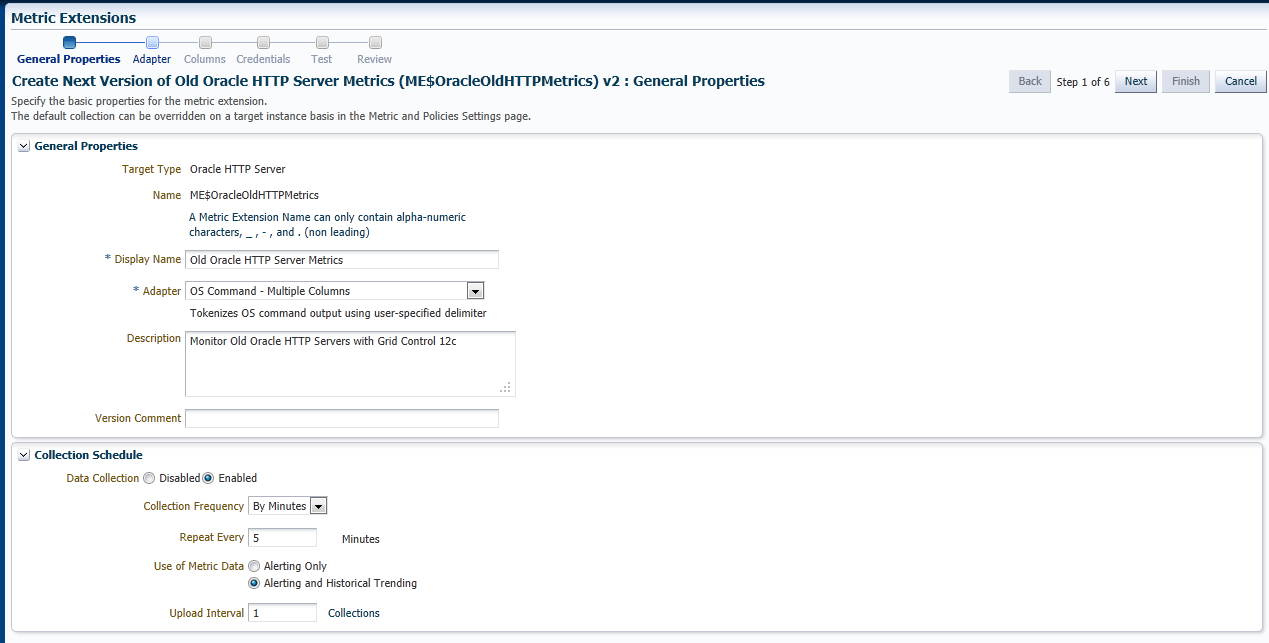
5. On the next screen provide adapter configuration. You should provide full path to shell script and also pass two parameters – http host name and listen http port. These parameters give as ability to deploy this metric extension to several HTTP Hosts. Of course shell script should be copied to these hosts into the same directory.
6. Press “Next” button to define metric extension columns
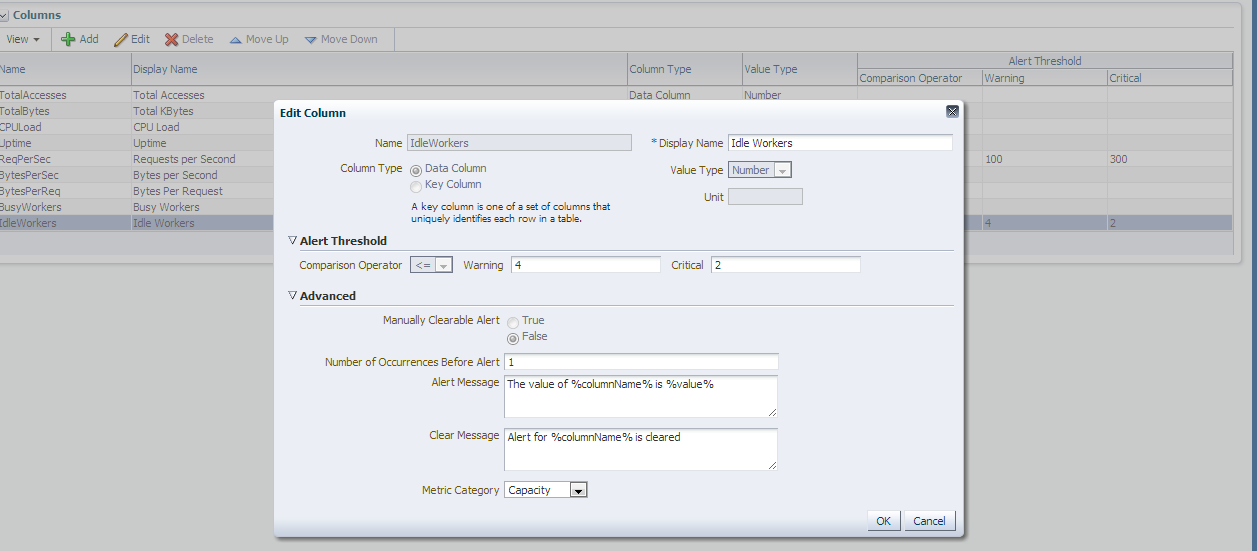
7. On the “Columns” step you can create from up to 10 metric columns to populate them with data from adapter. Also on this step you may define metric thresholds and comparison operator. On the screen below you see edit form for “Idle Workers” metric.
7. On this step you may redefine default monitoring credentials, we are going to use default one, so press “Next” button.
8. There you able to debug out metric. Add one or more targets to the Test Targets table. OEM automatically shows targets compatible with new extension. 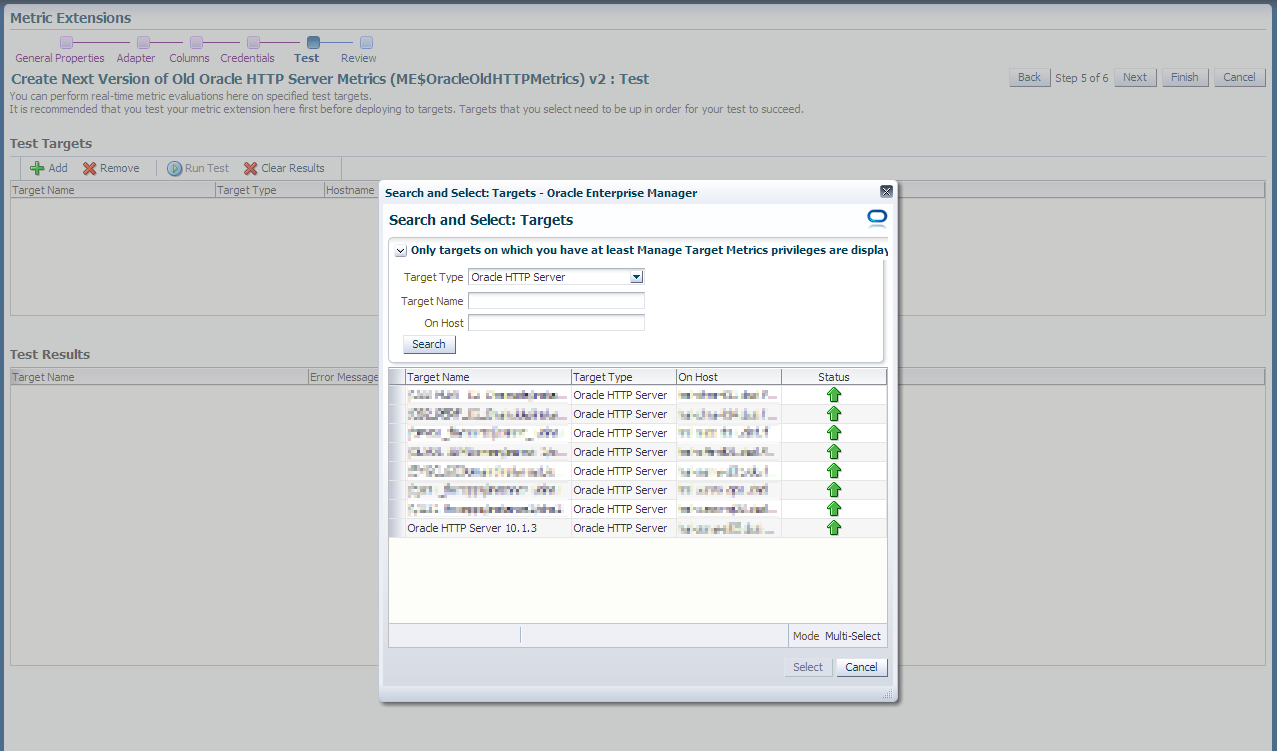
9. Select Oracle HTTP Server, which you configured earlier.
10. Run the test using  button and check results in the table below. If all steps was done correctly you will able to see something like this:
11. Press “Next” and review all metric extension properties on the one page.
12. If all the information seems fine, press “Finish” to save your new metric, otherwise you able to return back and make changes
Our new metric is created and ready. To start collect metric values we should deploy it to targets. To do it:
13. From the metric extensions list, select your metric.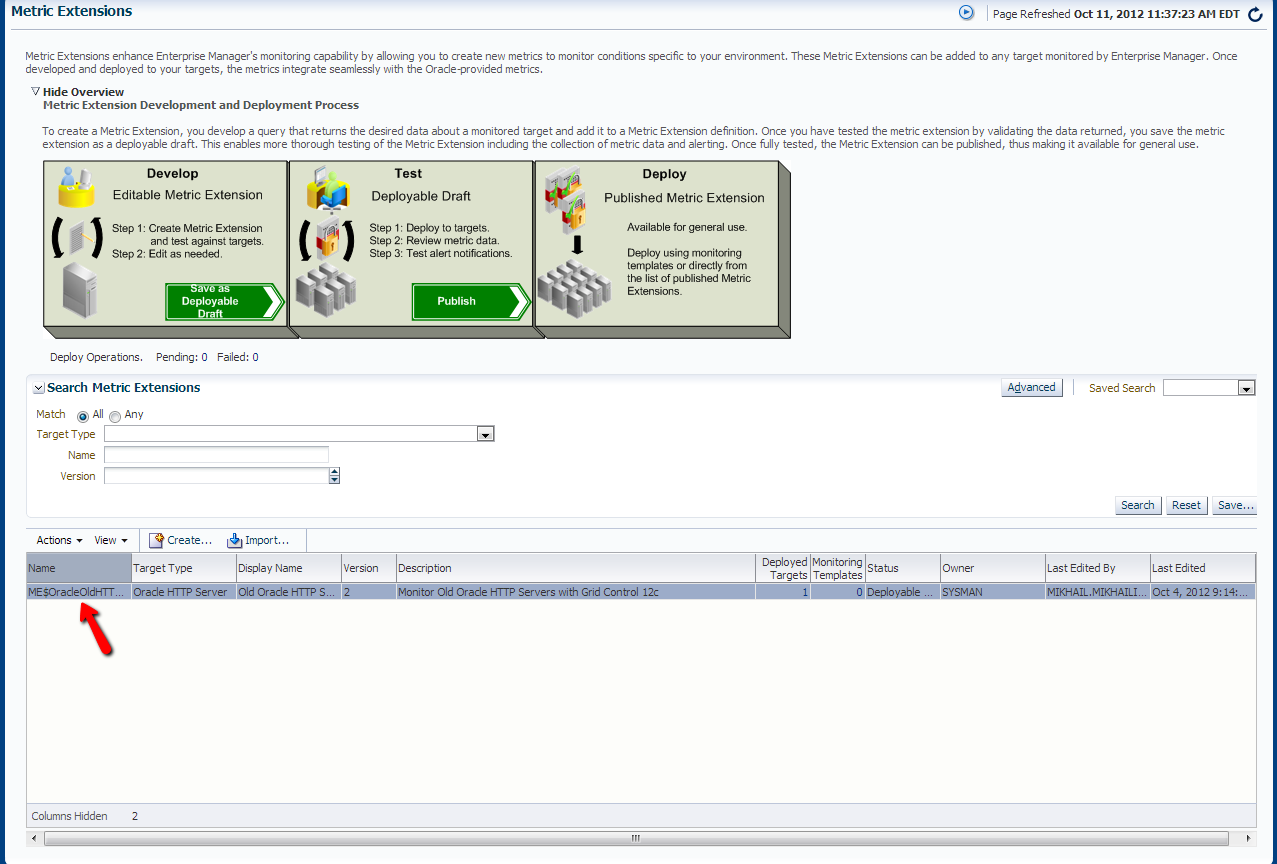
14. From the Actions dropdown menu select Deploy To Targets …
15. Press Add button to find and add existing targets to the table 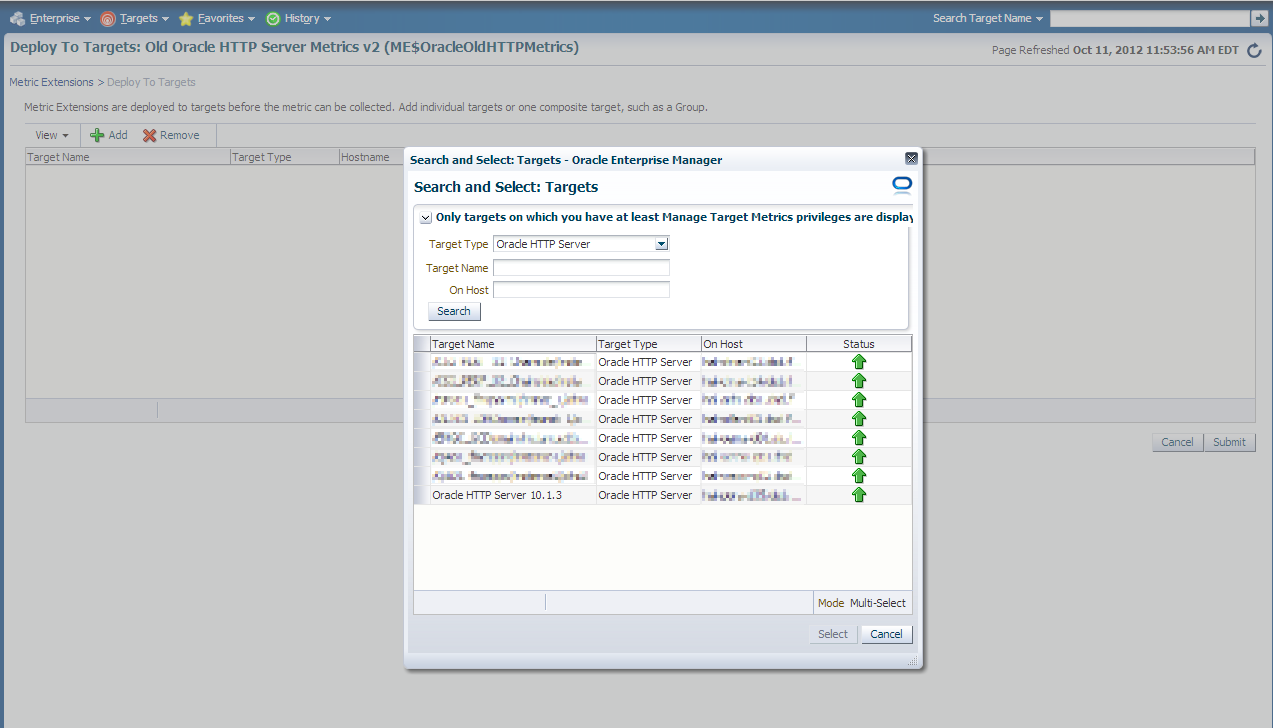

17. In the Metric Extensions list select your new extension and is dropdown Actions select Publish Extension.
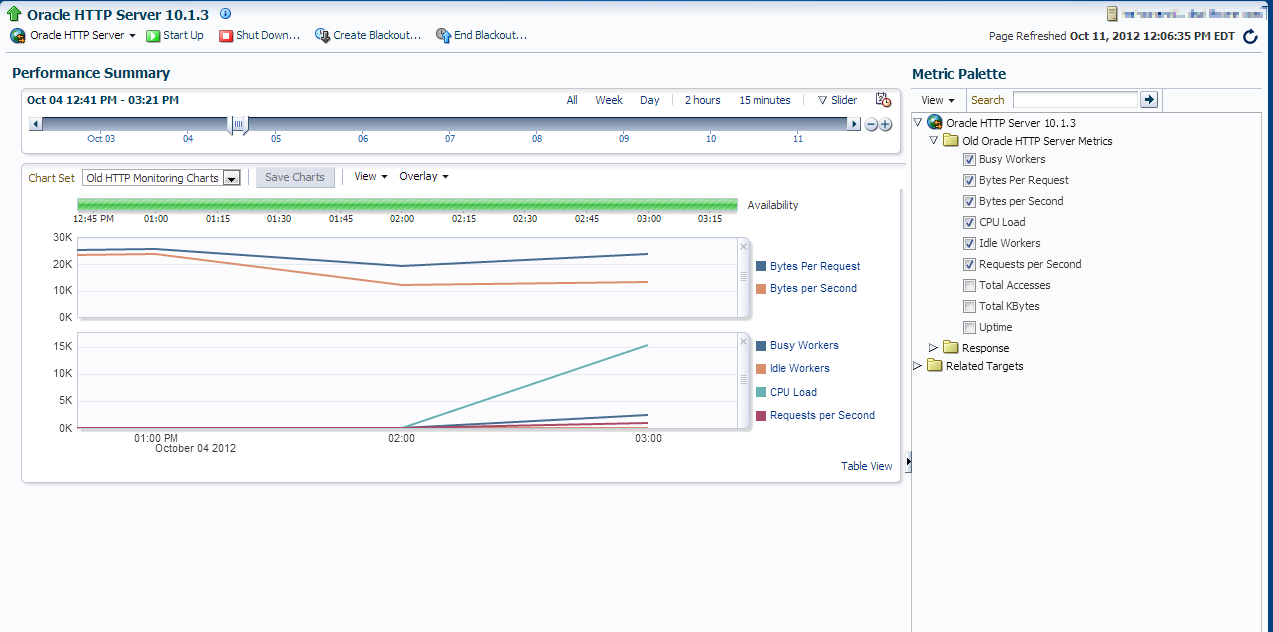
After deployment and publication new metrics are available for the selected targets. To check the values :
18. Open target’s home page. From the Target’s Main Menu select Monitoring -> All Targets
You will see Metrics tree on the left and metric values in the main area.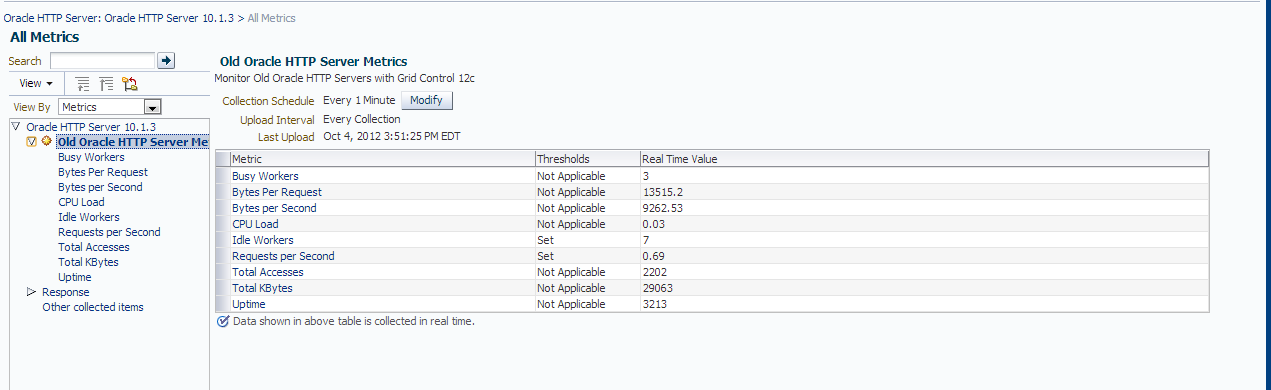
2 comments:
The idea in this article is quite different and innovative. Thanks for this.
SAS Training in Chennai
SAS Analytics Training in Chennai
clinical sas training in chennai
clinical sas course
clinical sas training fees
Placement Training in Chennai
soft skills training institutes in chennai
Thanks for sharing such informative article on Loadrunner Automation testing tool. This load testing tool will provide most precise information about the quality of software
Microsoft Windows Azure Training | Online Course | Certification in chennai | Microsoft Windows Azure Training | Online Course | Certification in bangalore | Microsoft Windows Azure Training | Online Course | Certification in hyderabad | Microsoft Windows Azure Training | Online Course | Certification in pune
Post a Comment