In our buggy development environment Weblogic management servers fails with OOM exception as leaves from the trees in the autumn. If we’ll forget for a while about the really best way – nice code, the second choice will be bounce management server and waiting for the next incident. Unfortunately in some cases you unable to stop those servers from console and kill OS process are the only option.
I do it automatically with a small process management trick and corrective actions, the really cool feature of Grid Control/Cloud Control.I’m going to make some preliminary assumptions:
- System runs on Linux/UNIX
- Find process id by managed server name
- Kill it with SIG_KILL level.
OS Script
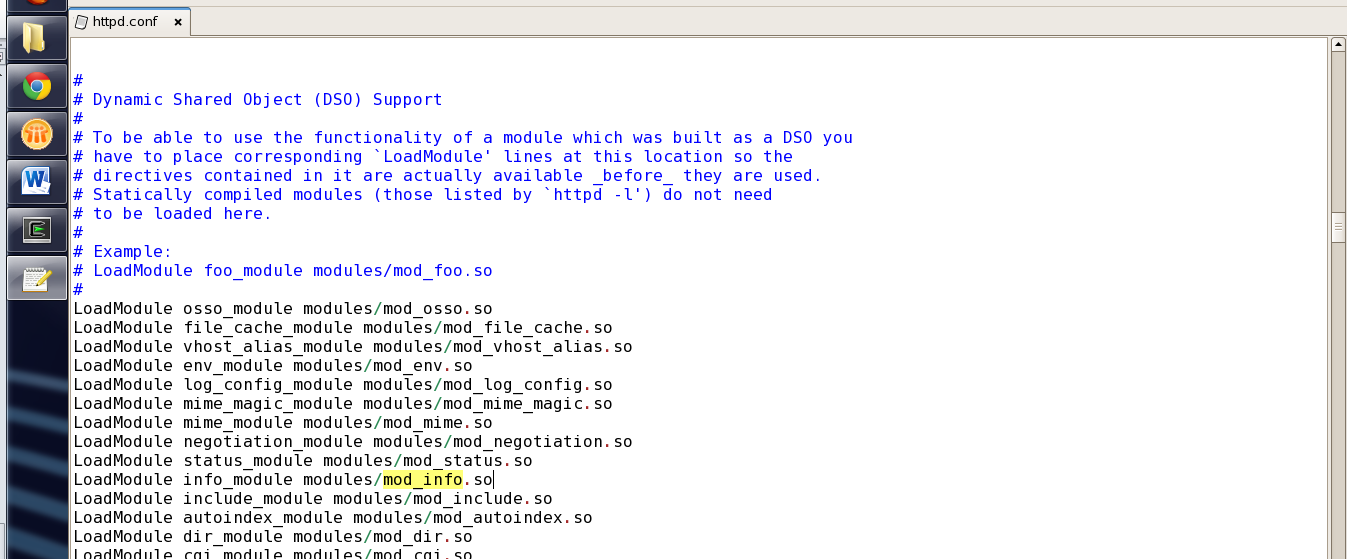
I’ve written the very simple shell script to find and kill managed server process. It literally contains 3 commands:#!/bin/sh
usr=`whoami`
plist=`ps -fu $usr |awk -v shl=$$ -v srv=$1 '$0~srv && $8~"java" {if ($3!=shl) print $2,$3}'`
kill $2 $plist
Script gets all current user processes. Then search process and parent process ids for process with substring passed as first parameter. The last step kills those processes with signal level passed as the second parameter.
Save this script to the file where it will be accessible for agent and give your group permission to execute it.
Actions Library
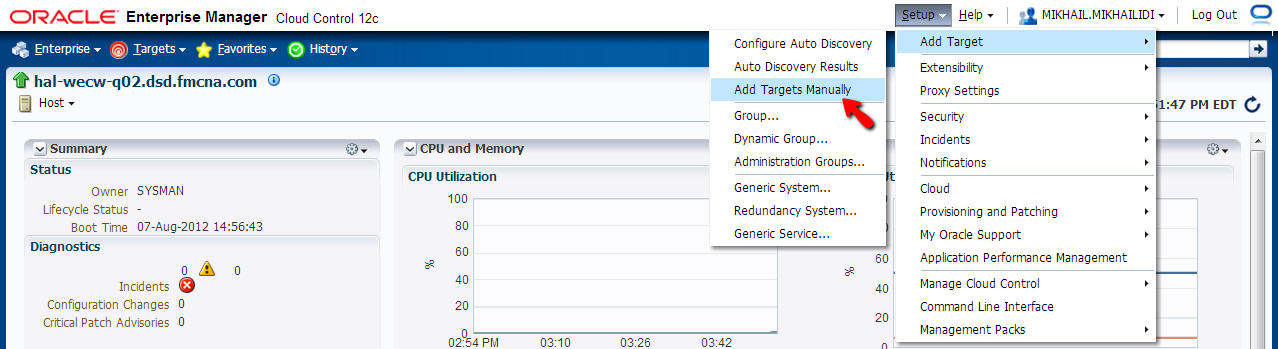
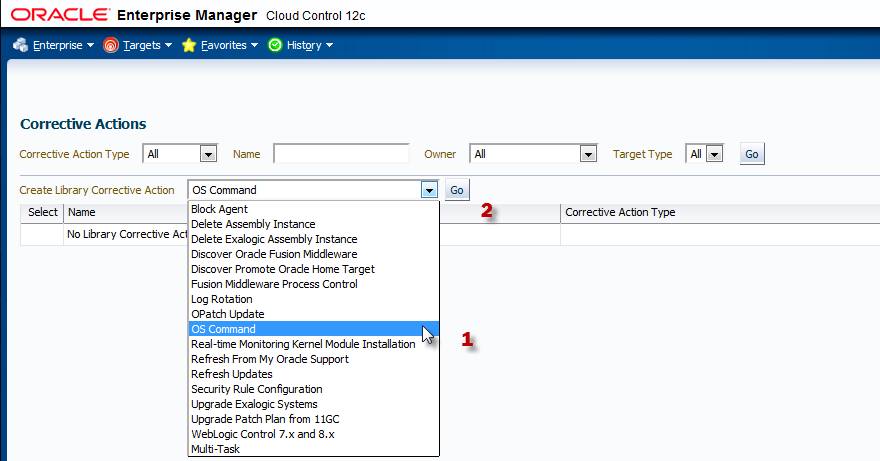
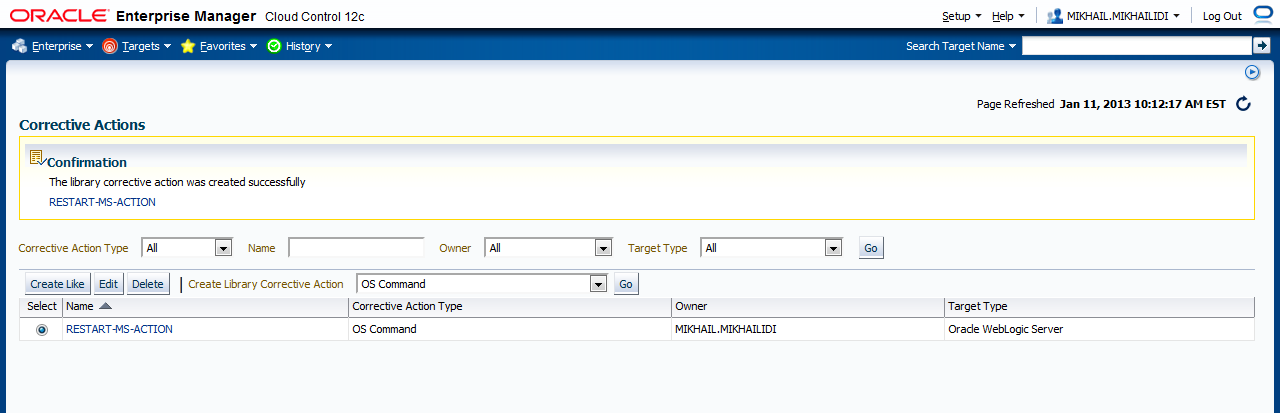
Now we should create corrective action in the actions library. It’s more about action templates then real actions, and later you will see it. To create new action, you should do the follow steps:- Open Corrective Actions pages from Main Menu: Enterprise – Monitoring – Corrective Actions
- Select OS Command from the drop down box in the row “Create Library Corrective Action” right above the table and press Go button.
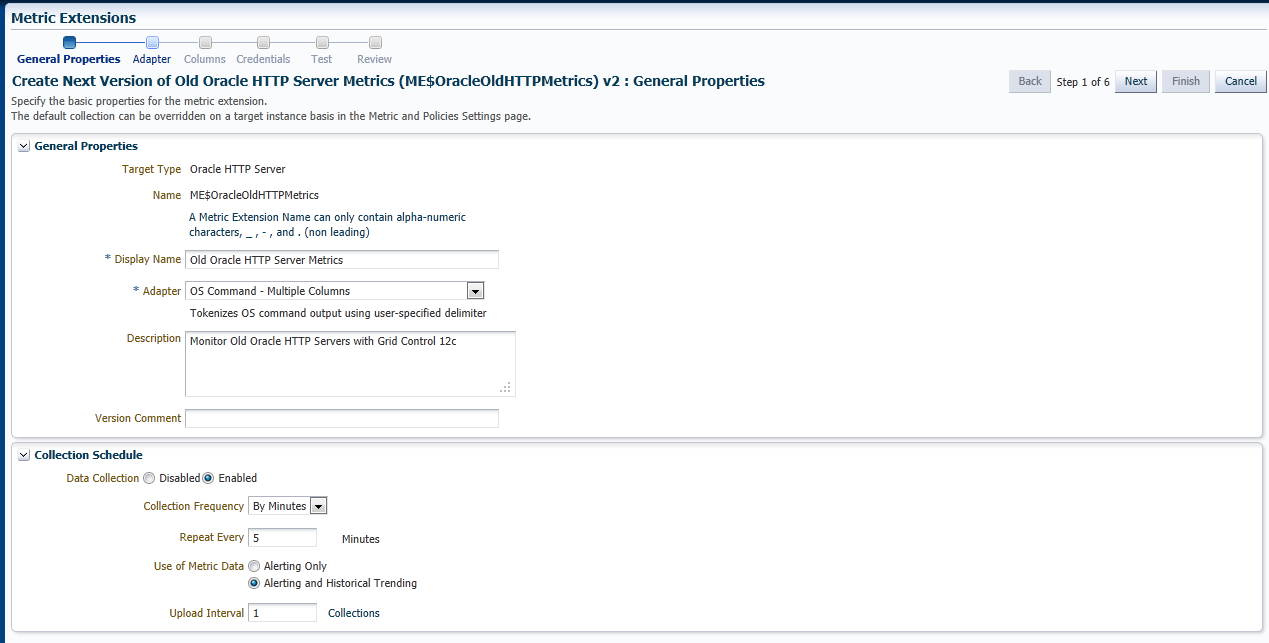
- On General tab fill Action name, Description and select Target Type. The last one is very important because it defines will you action available for your targets and their metrics or not.
- Click on Parameters Tab
- Select Single operation as a Command Type and type the command in the Command field. For such small scripts there is “Script” option that allows you type all OS commands inside the action. There is pro and cons, but I prefer to use script files and call them as a single command.
- Cloud Control has a plenty amount of substitution variables. It allows us to use one action for every server that we are going to instrument. Full command line should looks like:


/home/oracle/bin/msfire.sh %ServerNames% -9
- Press Credentials tab. We can use preferred credentials for host (and it will be determined at runtime), you can define new credentials if you sure that they will be the same on every host or use one of existing pairs.
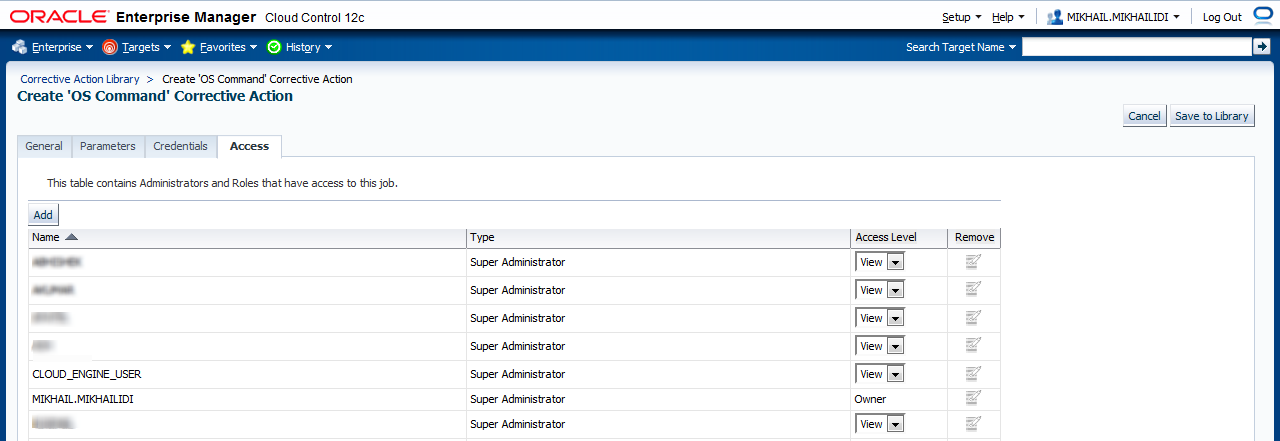
- The last tab is Access. You may define access level for other administrators or roles, defined in your system.
- When all parameters were set, press Save to Library button
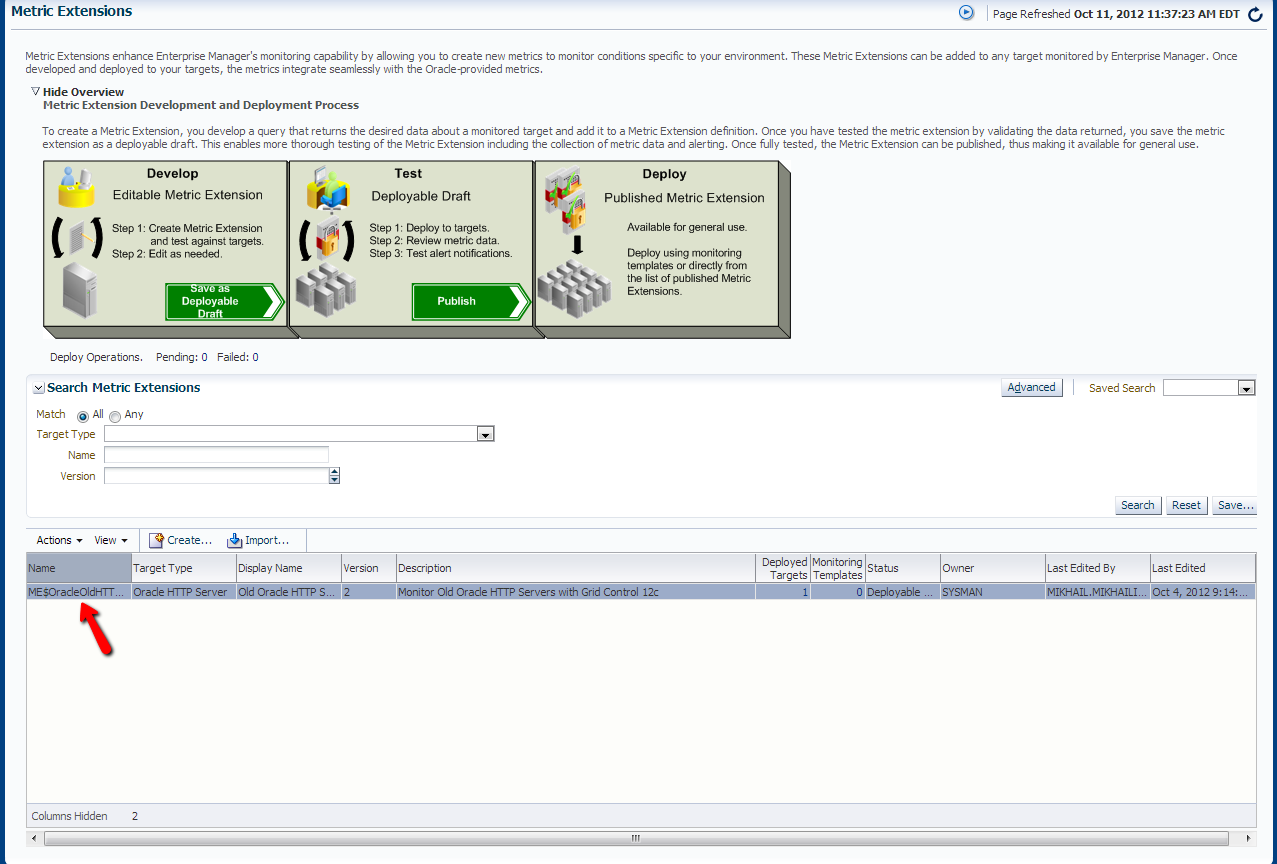
- The new action will appears in the Corrective Actions list.

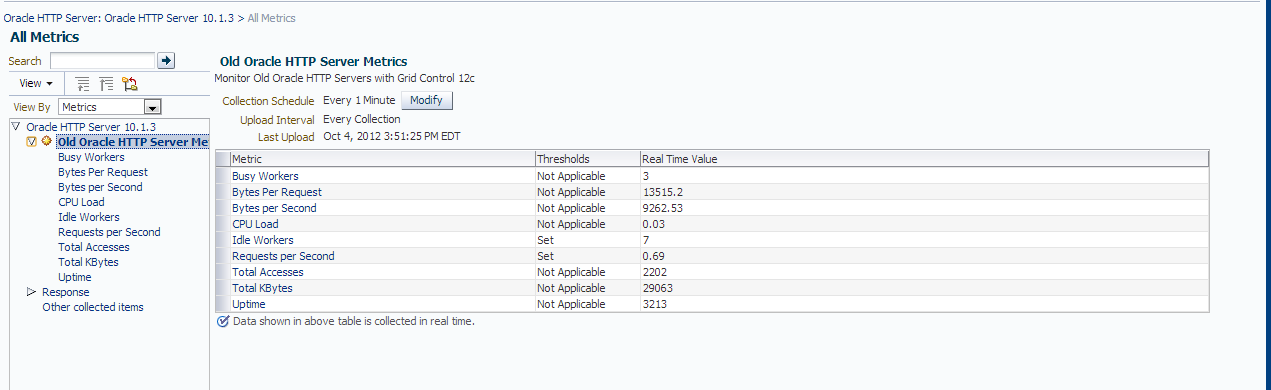
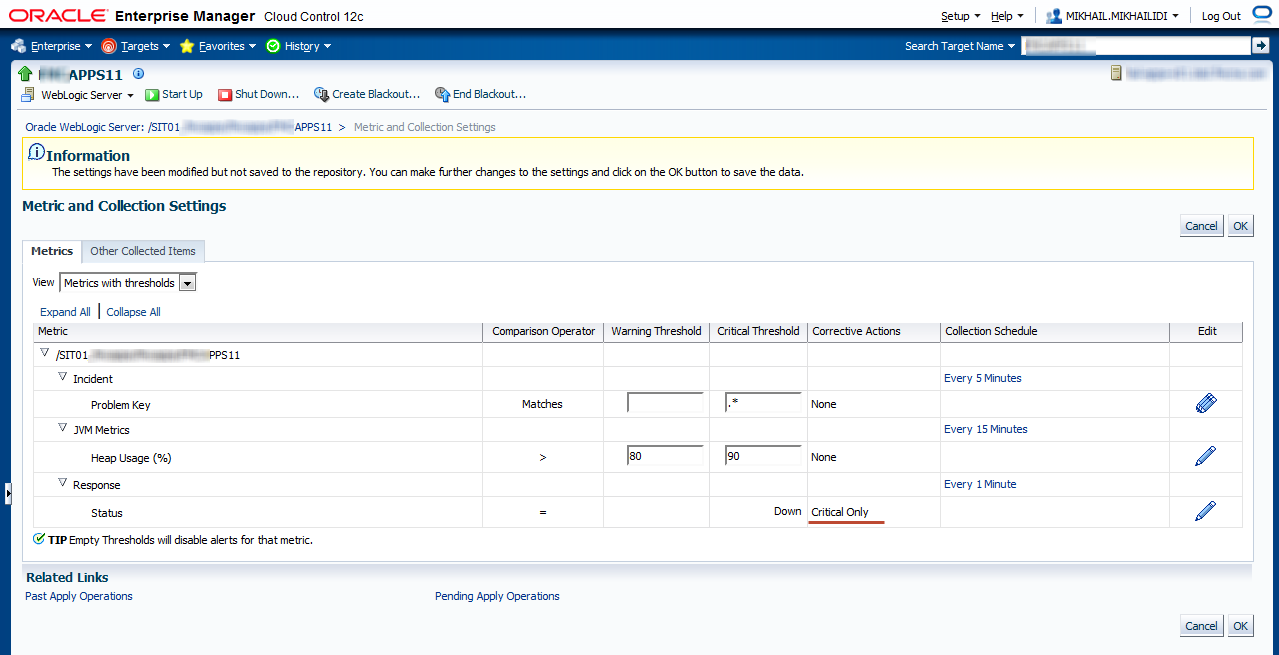
Metric and Collection Settings
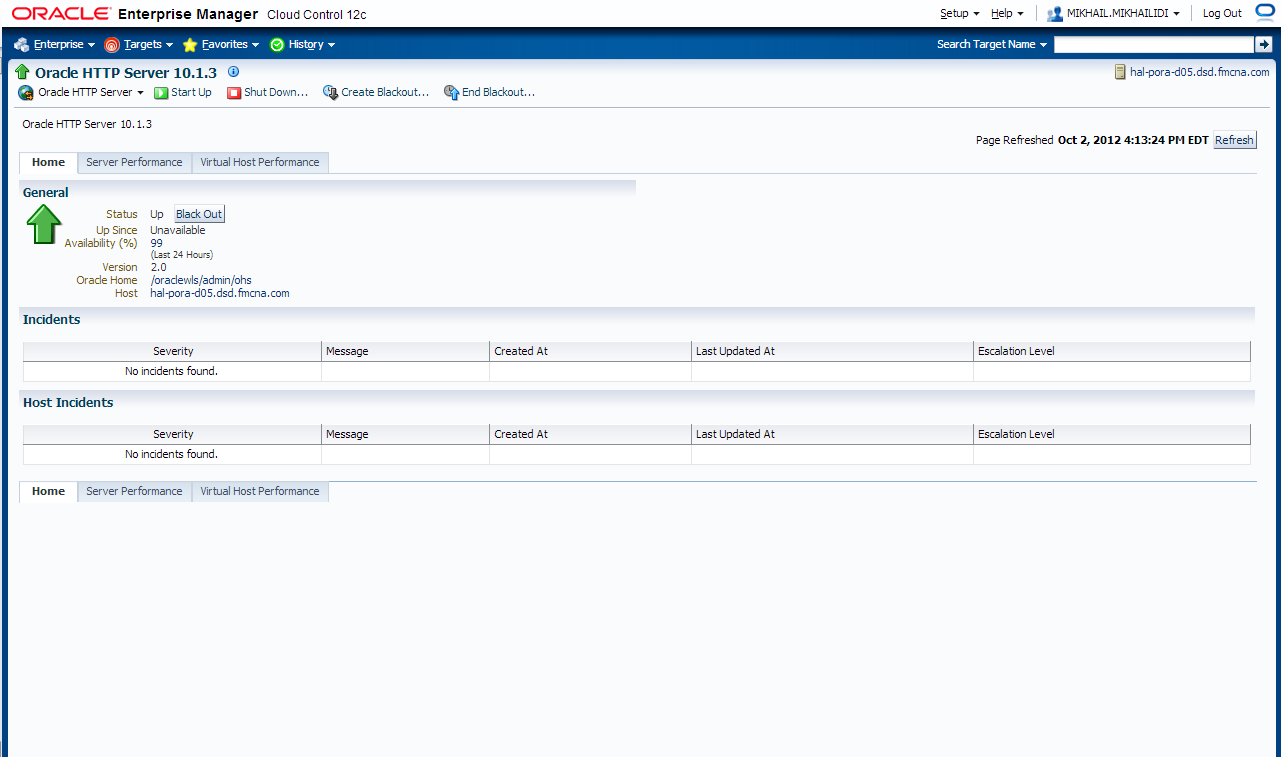
We have issues with a couple of managed servers, so I’m not going to create or modify monitoring template. We just apply it for Weblogic server status metric. To do this, follow the steps below.- Locate Weblogic Server and open Target Page. You may just type in server name in global Search field and press Enter. Then click on the target link
- From the Target Menu select Monitoring then Metric and Collection Settings
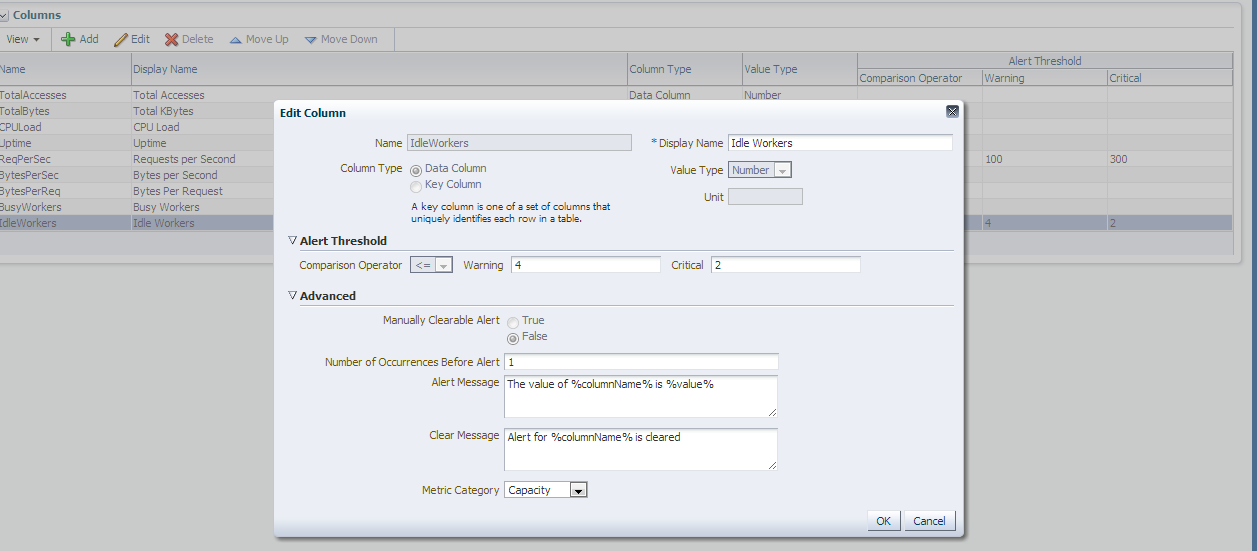
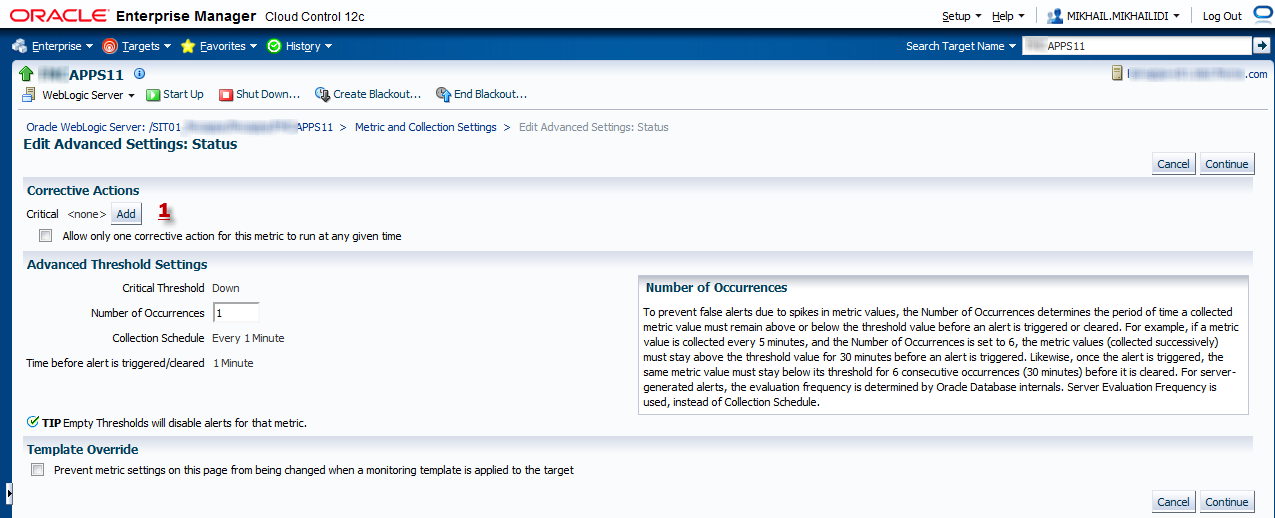
- Find Status metric in the Metrics table. Press on the blue pencil in Edit column
- In Advanced settings form click on Add button
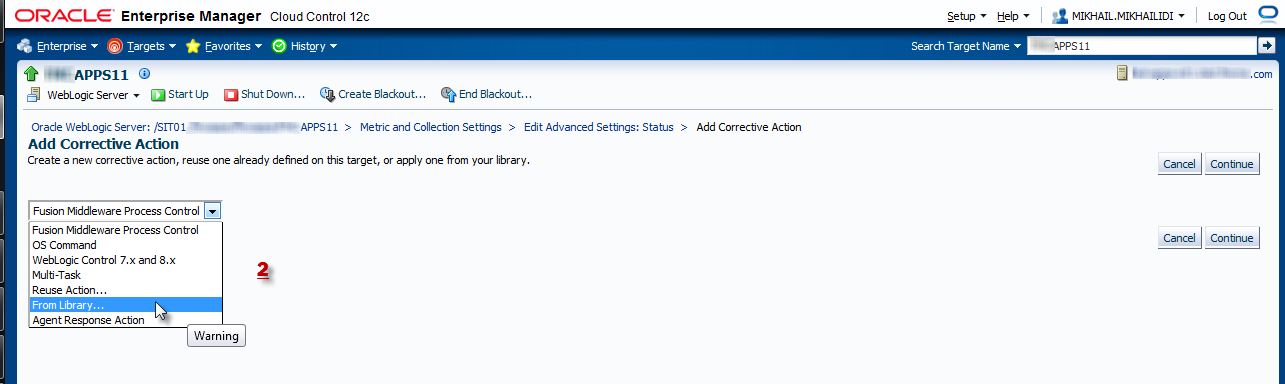
- In Add Corrective Action Form select “From Library …” option and click Continue button.
- Select Action that we created before and click Continue
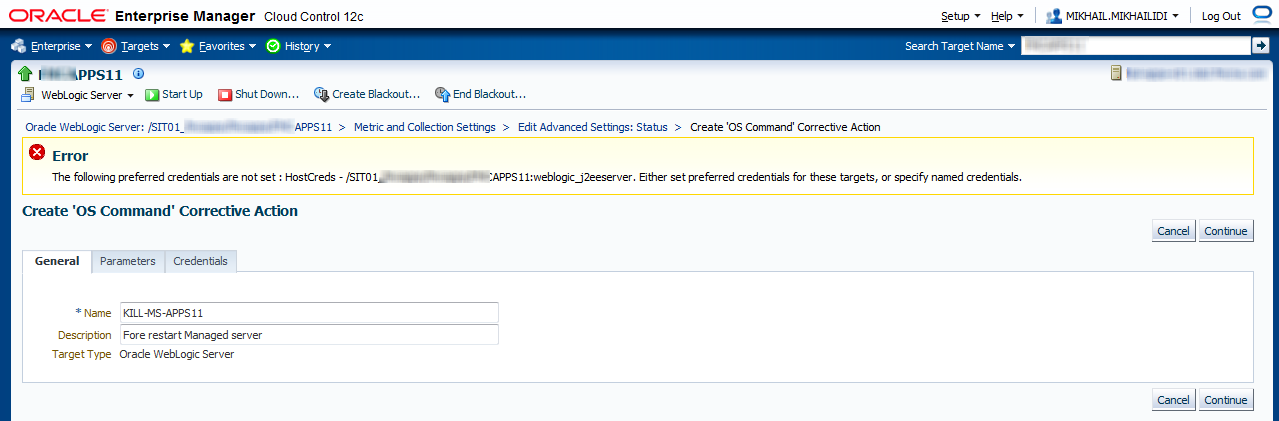
- You will see exactly the same form as you seen during create action in the library. Type name for new corrective action on General tab.
- Press Continue button. If your target has no preferred credentials you may receive error message as on screenshot below:
- On Credentials tab you may create new credentials pair or select one of named pairs.
- Click Continue button. You will be returned to Advanced Settings page. Check “Allow only one corrective action …”
- Click Continue button to save settings for Status metric.
- In Metric and Collection Settings table you may see that Status row has a new status in Corrective Actions column.
- Press Ok to close Settings page.


Results
Now, anytime when Status metric will have critical value (in this case it means “Down”) Cloud Control will address this issue with corrective action. Let’s take a look to real incident and actions below.
Cloud Control Agent assumes that Weblogic server is down and notifies Cloud Control Server about.

Regarding Incidents Rules, Cloud Control notifies administrators (me for instance) AND run registered Corrective Action for this metric and you can see additional information on the Incident Details page.
Also you may check the execution steps and command output details.